Dashboard & Reporting
The dashboard is the single screen for gauging the health of registrations and claims.
warrantini has one main dashboard screen, reached from the top-level Dashboard item in the sidebar. It is the only reporting surface in the product today — there is no separate Reports or Analytics page, and no chart library renders anywhere on it.
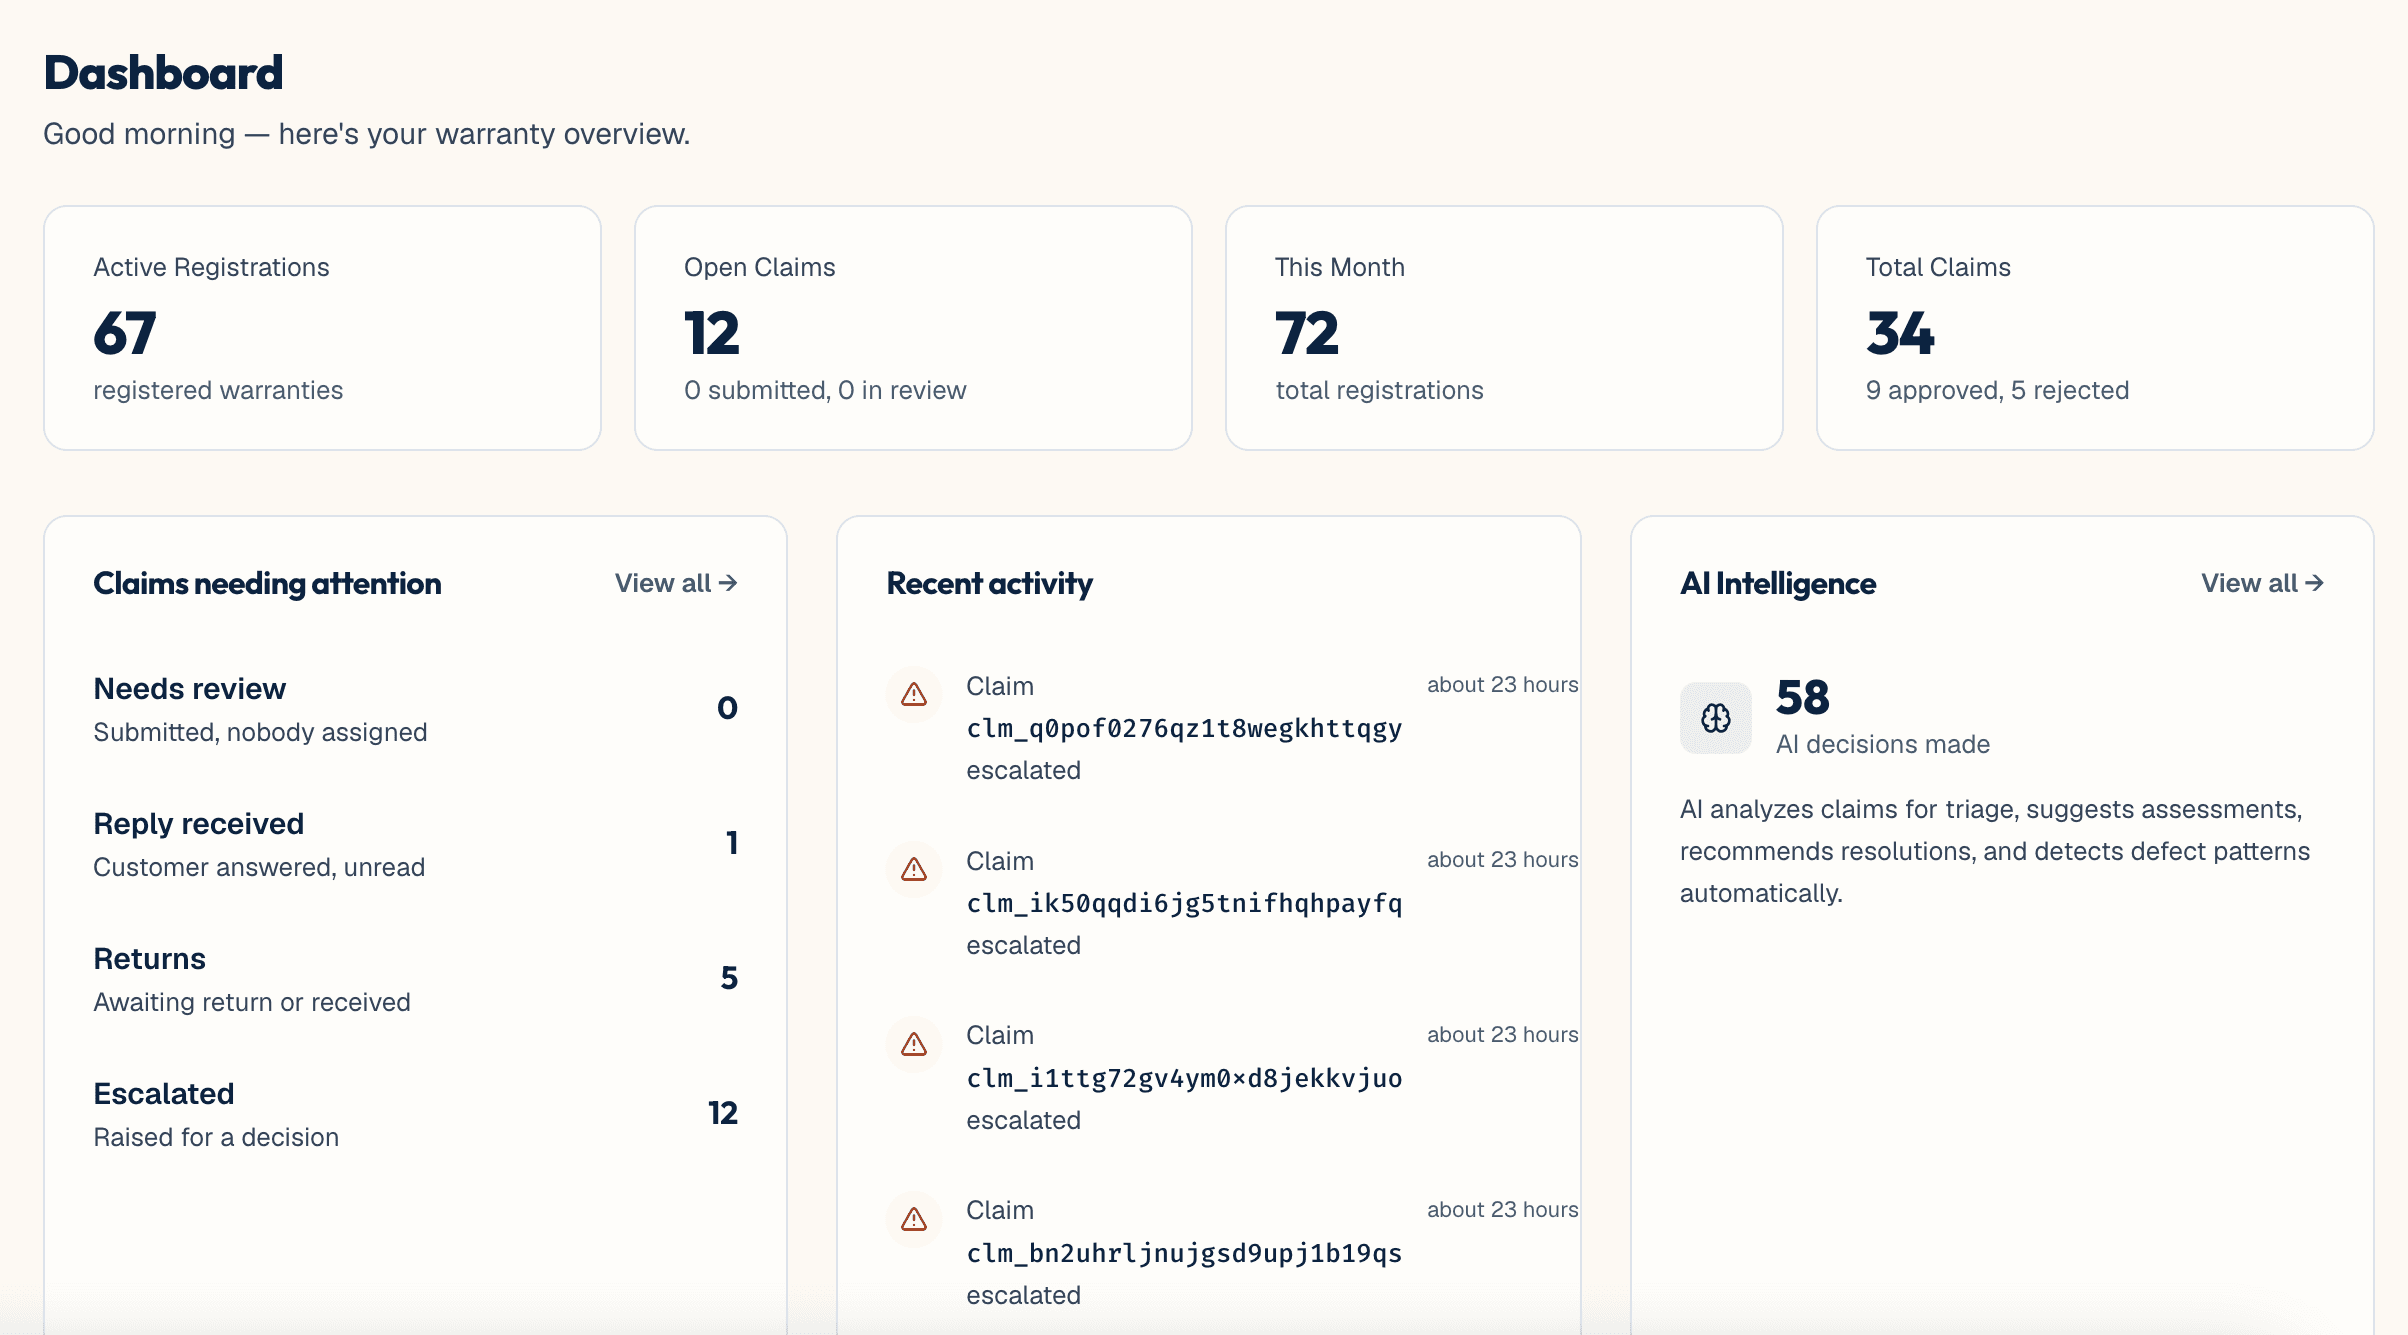
Four cards run across the top of the dashboard:
- Active Registrations — the count of currently active warranty registrations. This is the number to watch for how much of what you sell is actually getting registered.
- Open Claims — submitted, in-review, and escalated claims added together. This is what's currently in flight and needs attention.
- This Month — labeled as a monthly figure
- Total Claims — the cumulative claim count since the account started, broken down into approved/resolved vs. rejected in the subtext below the number.
Each row links directly into that queue on the Claims page (top-level Claims sidebar item); "View all" opens every claim across all attention queues combined.
A live feed of recent events — registrations created, registration status changes, claims submitted, claim status changes, and order sync completions or failures — each shown with a relative timestamp.
A summary card showing the total count of AI decisions made across the account, with a short description of what the AI layer does. "View all" opens the full Intelligence dashboard (Dashboard → Intelligence) — covered in detail in the AI & Intelligence guide.
Of everything on the page, three numbers matter most for a quick health read:
- Active Registrations — how much of what's sold is actually registered.
- Open Claims — what's currently in flight.
- Total Claims — the cumulative picture, split approved/resolved vs. rejected.
See also: AI & Intelligence (/docs/ai-and-intelligence) for what the Intelligence dashboard covers beyond this summary card.